JaguarSX Screenshots
JaguarSX has a background monitoring process, an easy-to-use native console application (versions available for all operating systems) - and a fully customizable web-based user interface, allowing one to create custom views, create custom reports, and monitor the IT infrastructure all with just a couple of clicks. Here are just a couple examples of the things you can do with Jaguar SX.
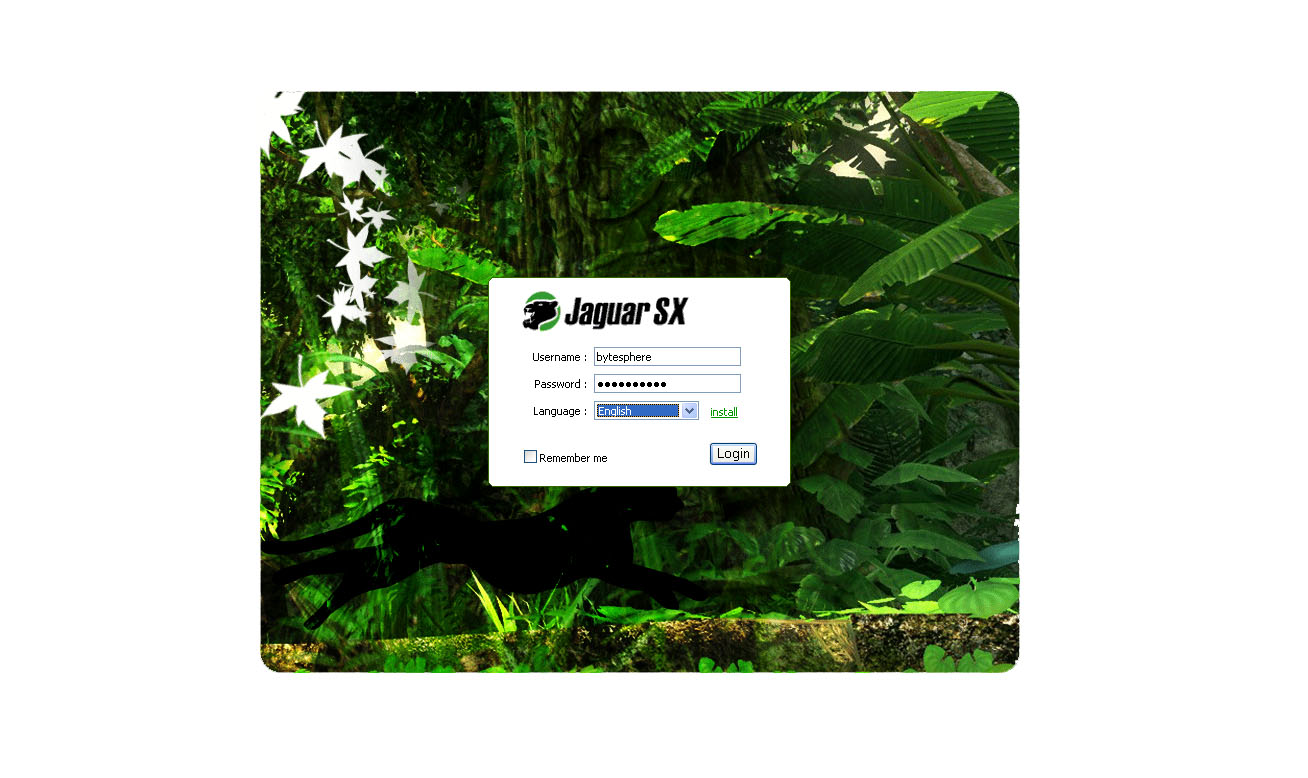 Web-UI Login Screen - Jaguar's WEB-based UI handles not only multiple users, but multiple languages as well. Proxy logins supported for admins. |
 and view status displays. |
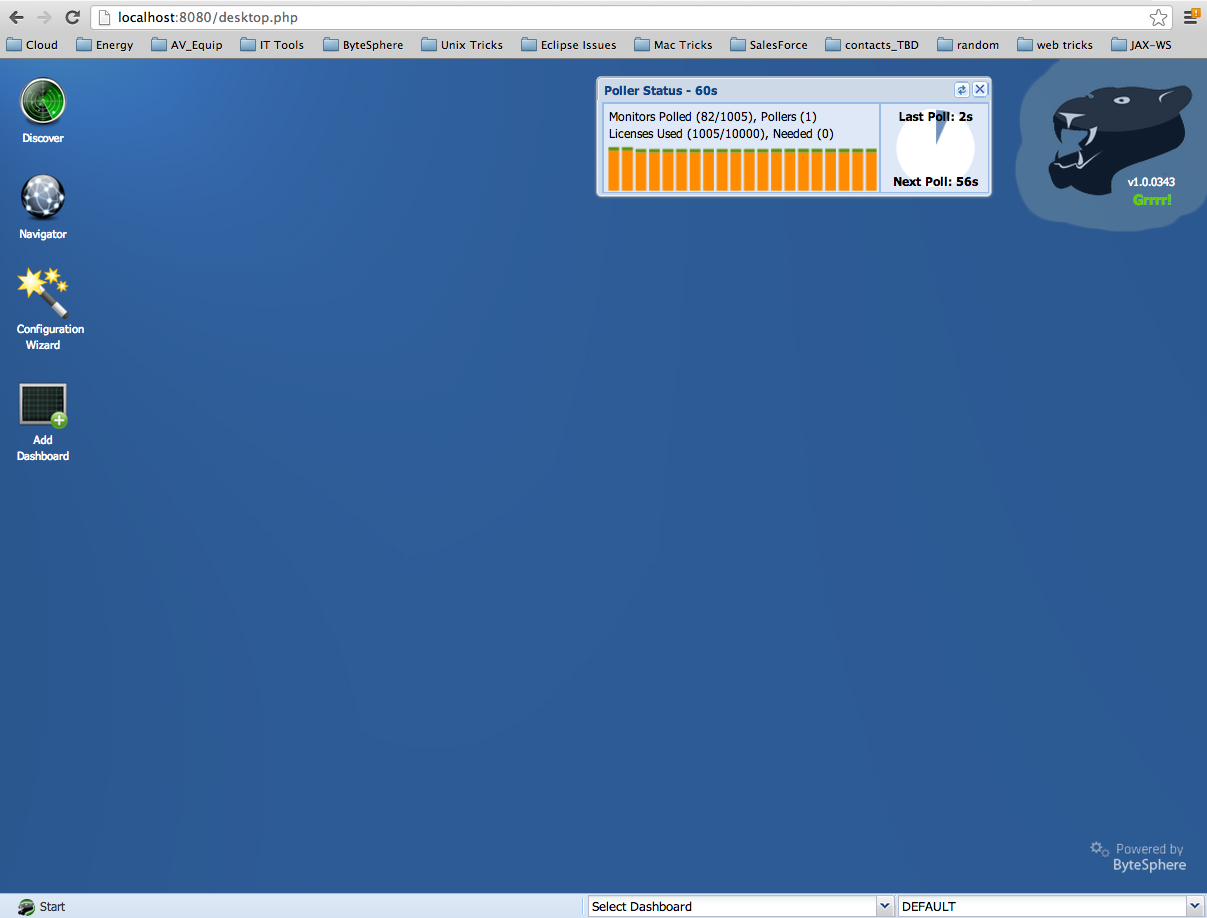
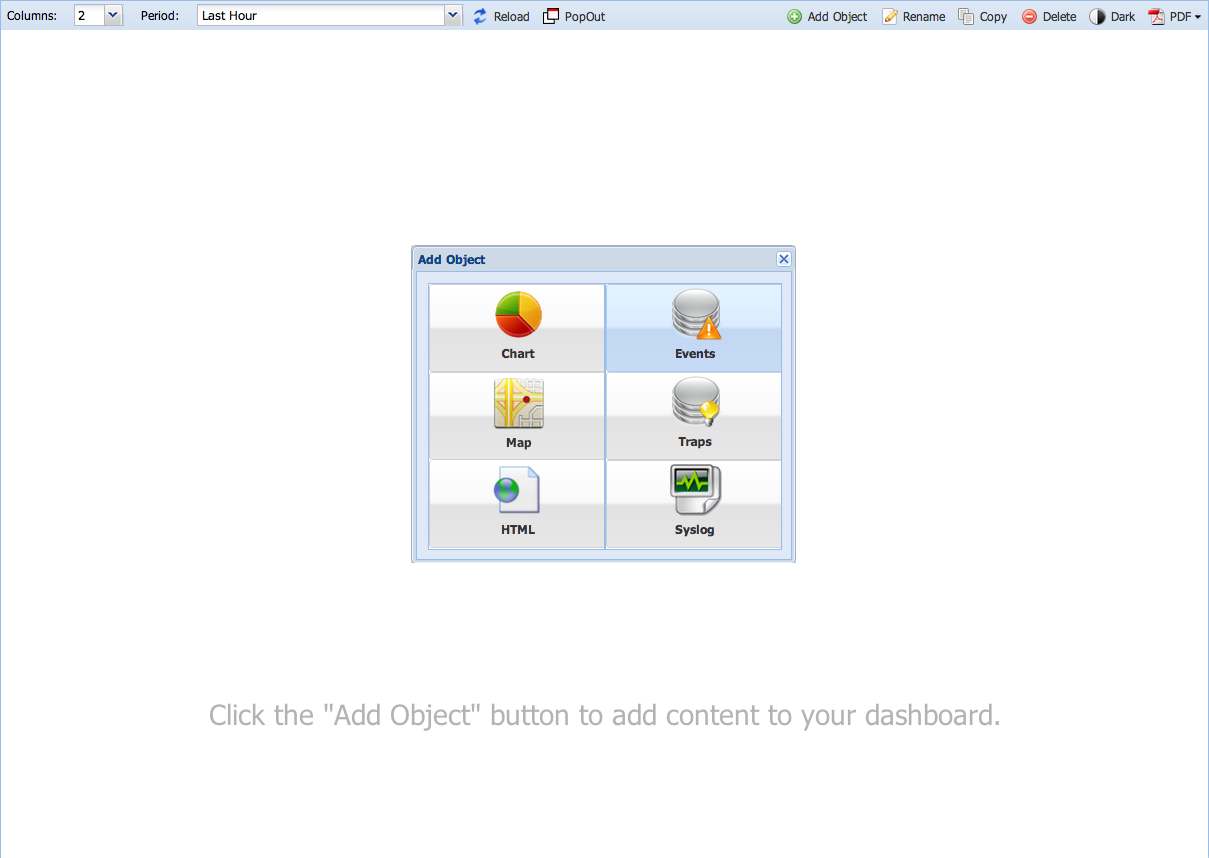 Create Custom Dashboards - Create as many customized dashboards as you need, clone for other users or user profiles. |
 |
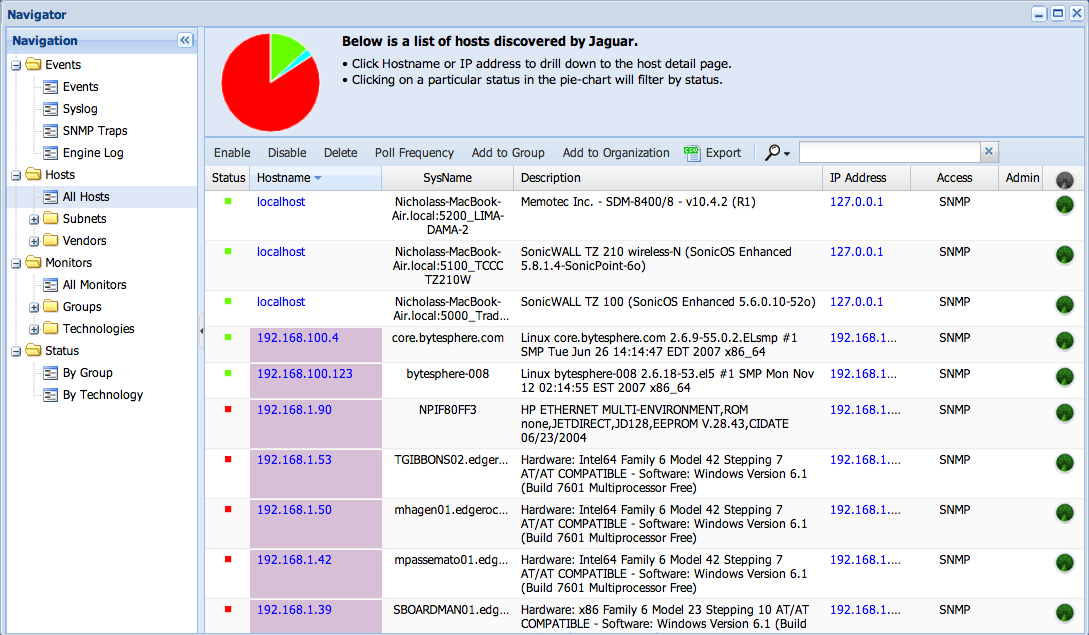
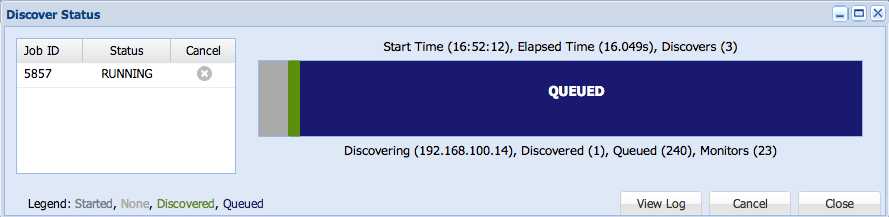
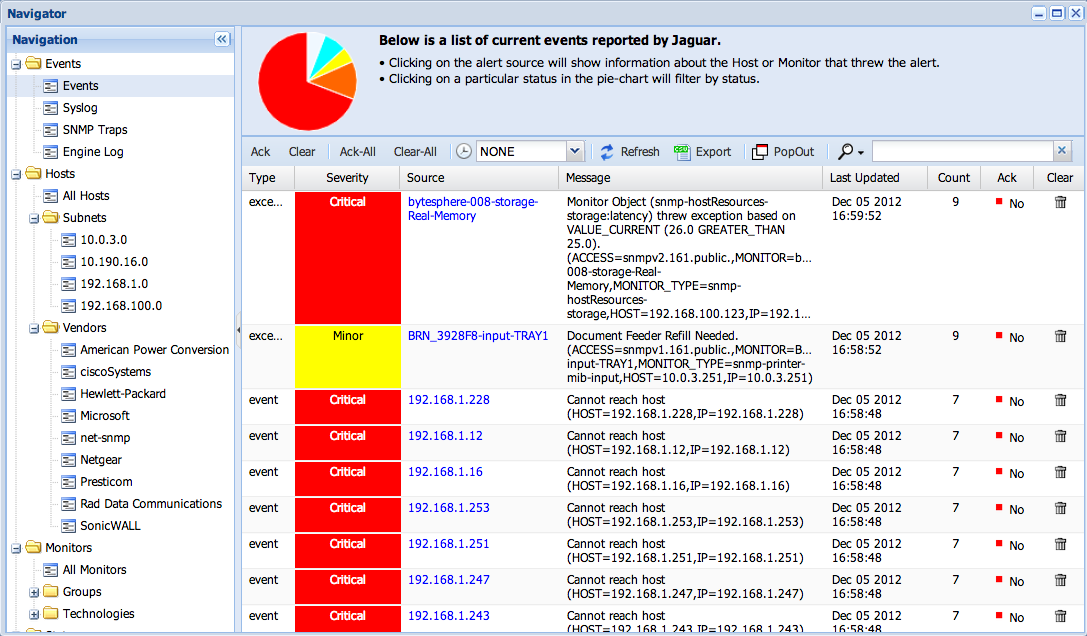 Navigator Events View - Shows overall events in the system. Also available are customized views for Traps, Syslog, etc. |
 |
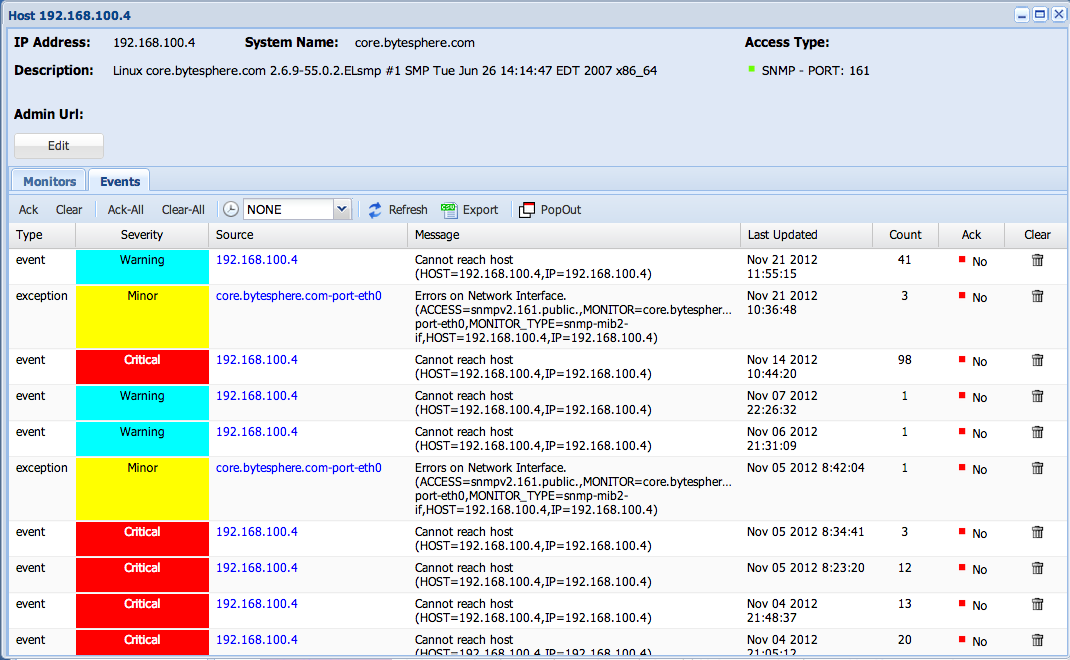
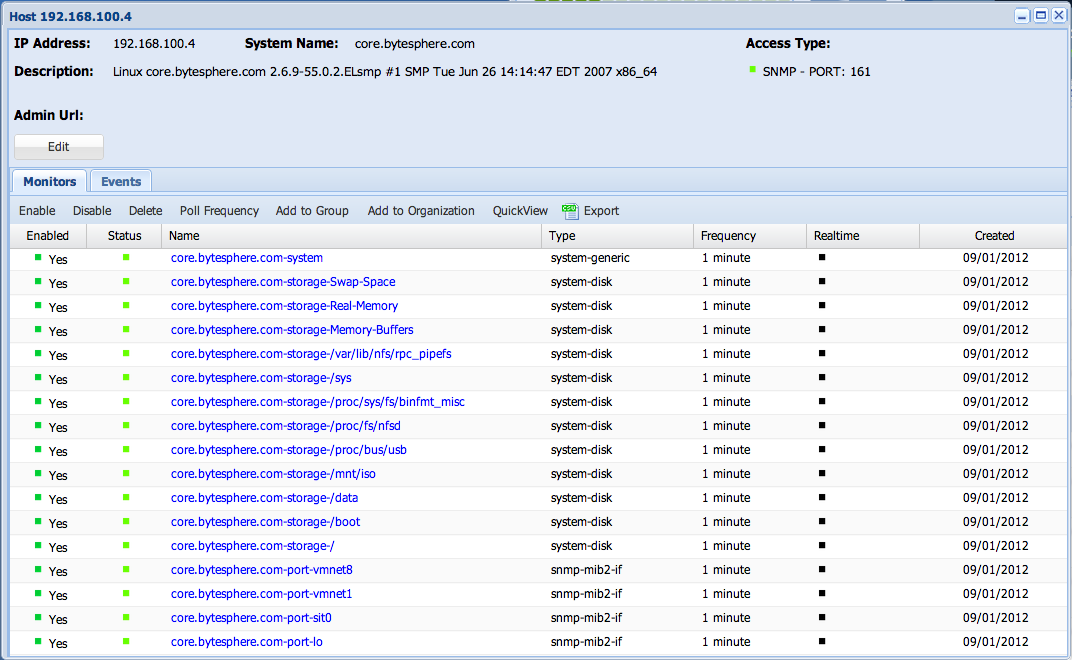 Host Monitors View - Shows a list of monitored elements for the selected Host Device. |
 |
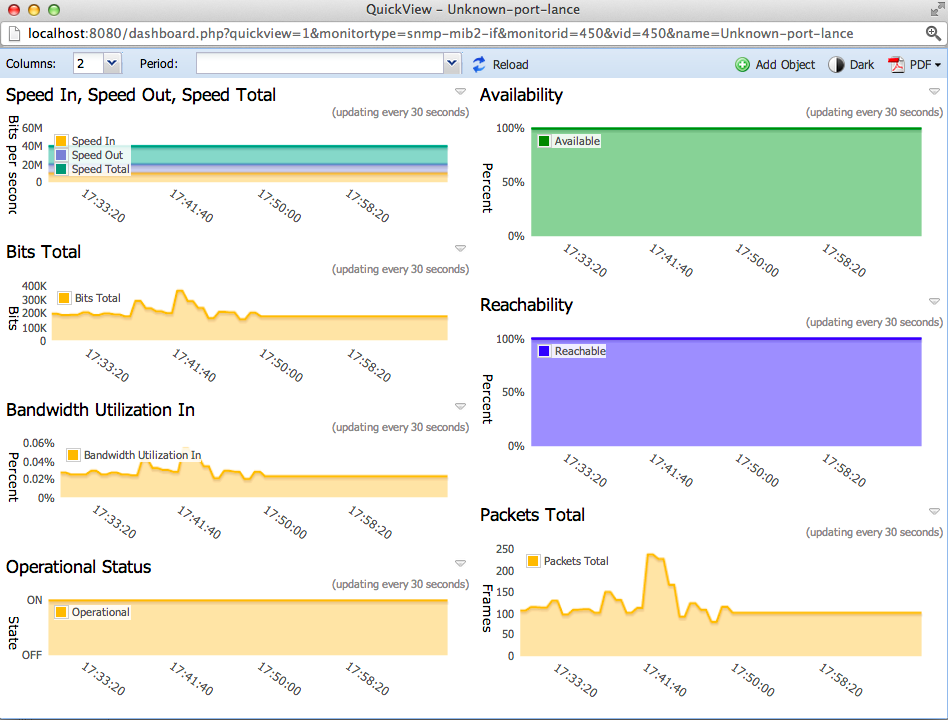 Realtime Quickview - Drilling down on an element gives you a historical or realtime quickview of monitored objects. |
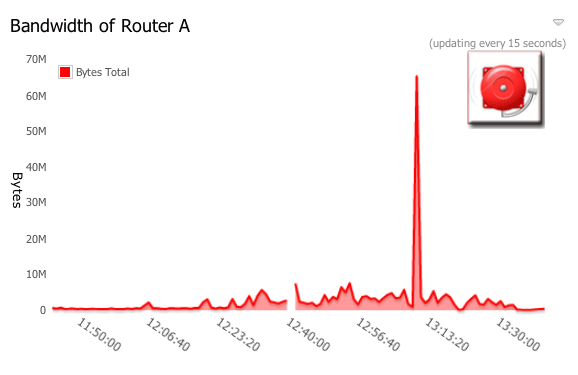 |
 Jaguar API - If you prefer working from command line, work from the CLI using the API interface |
 |
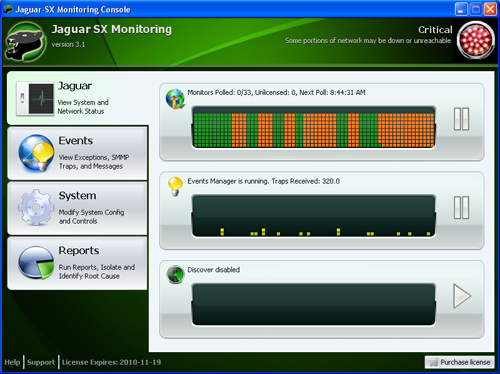 Jaguar Native Console UI - Jaguar's easy to use native console UI, where you can tell at a glance how everything is running. |
 |